Utility for Line Plot
Usage
line_plot(
  datain,
  series_var = "TRTVAR",
  series_labelvar = series_var,
  series_opts = plot_aes_opts(datain, "TRTVAR"),
  axis_opts = plot_axis_opts(),
  legend_opts = list(label = "", pos = "bottom", dir = "horizontal"),
  griddisplay = "N",
  plot_title = NULL,
  dodge_width = NULL
)
Arguments
- datain
Input dataset from process_line_plot_data() output.
- series_var
Series (Treatment) Variable.
- series_labelvar
Series (Treatment) Variable labels for legend, if different from
series_var. If this is needed, thenseries_labelvarshould be a factor variable with levels corresponding toseries_var, also a factor.- series_opts
Series Variable styling options, a
listcontainingshape,colorandsize.- axis_opts
A
listof axis specific options retrieved fromplot_axis_opts().- legend_opts
Legend styling option, a
listcontaininglabel,pos(position) anddir(direction).- griddisplay
Display Grid
(Y/N).- plot_title
Text to use as plot title, if required
- dodge_width
Width to dodge points/lines by, IF required.
Examples
data("adsl")
adsl_entry <- mentry(
datain = adsl,
subset = "EFFFL=='Y'",
byvar = "RACE",
trtvar = "TRT01A",
trtsort = "TRT01AN",
pop_fil = NA
)
adsl_sum <- msumstat(
datain = adsl_entry,
dptvar = "AGE",
statvar = "mean"
)
#> msum success
adsl_sum$gsum <- adsl_sum$gsum |>
dplyr::mutate(
XVAR = forcats::fct_reorder(.data[["BYVAR1"]], .data[["BYVAR1N"]]),
YVAR = as.numeric(.data[["mean"]])
)
#> Warning: There was 1 warning in `dplyr::mutate()`.
#> ℹ In argument: `YVAR = as.numeric(.data[["mean"]])`.
#> Caused by warning:
#> ! NAs introduced by coercion
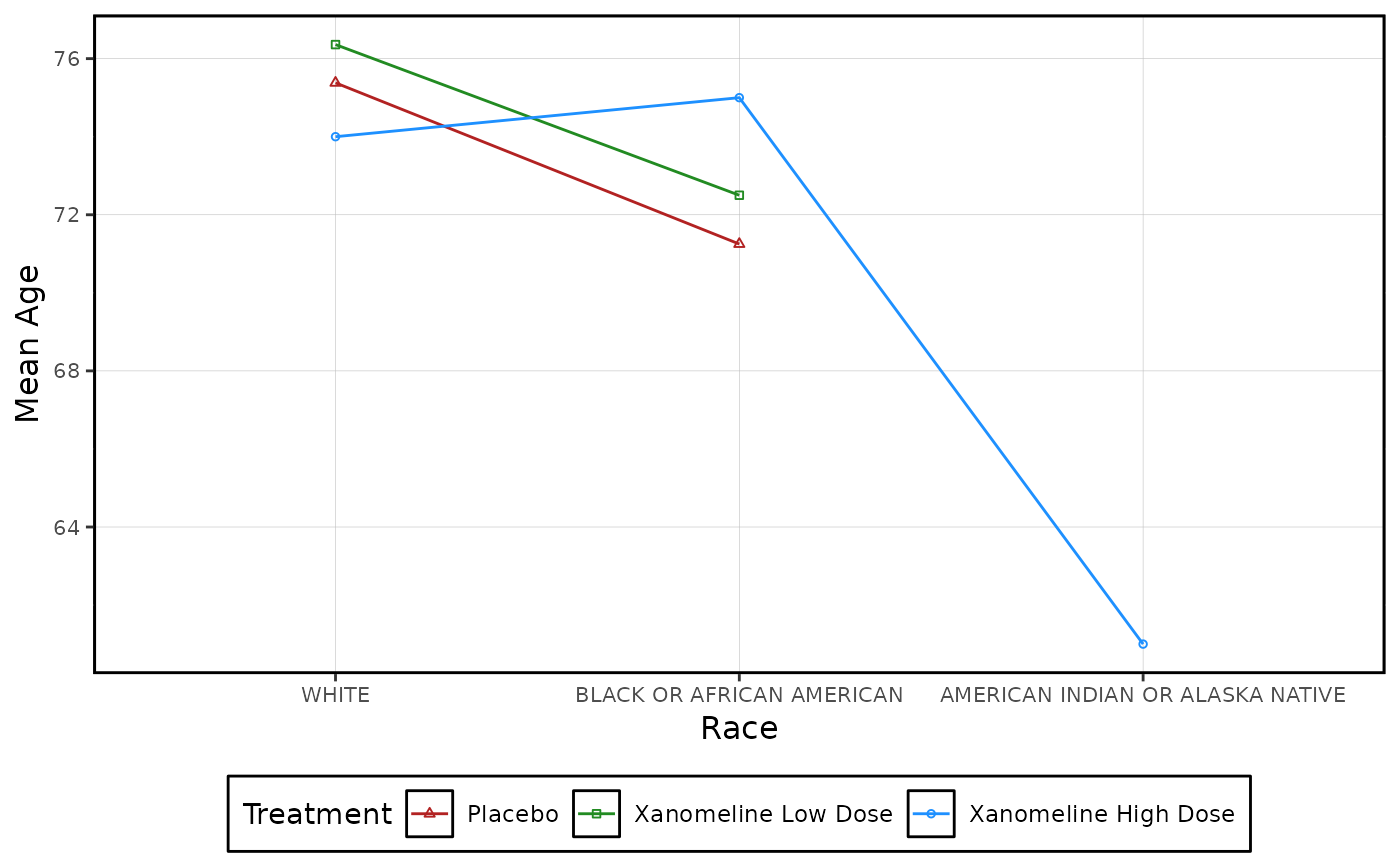
line_plot(
datain = adsl_sum$gsum,
axis_opts = plot_axis_opts(xaxis_label = "Race", yaxis_label = "Mean Age"),
legend_opts = list(
label = "Treatment", pos = "bottom",
dir = "horizontal"
),
series_opts = plot_aes_opts(
adsl_sum$gsum,
"TRTVAR",
series_color = "firebrick~forestgreen~dodgerblue",
series_shape = "triangle~square~circle"
),
griddisplay = "Y"
)
#> Line Plot Generated
#> Warning: Removed 2 rows containing missing values or values outside the scale range
#> (`geom_line()`).
#> Warning: Removed 2 rows containing missing values or values outside the scale range
#> (`geom_point()`).