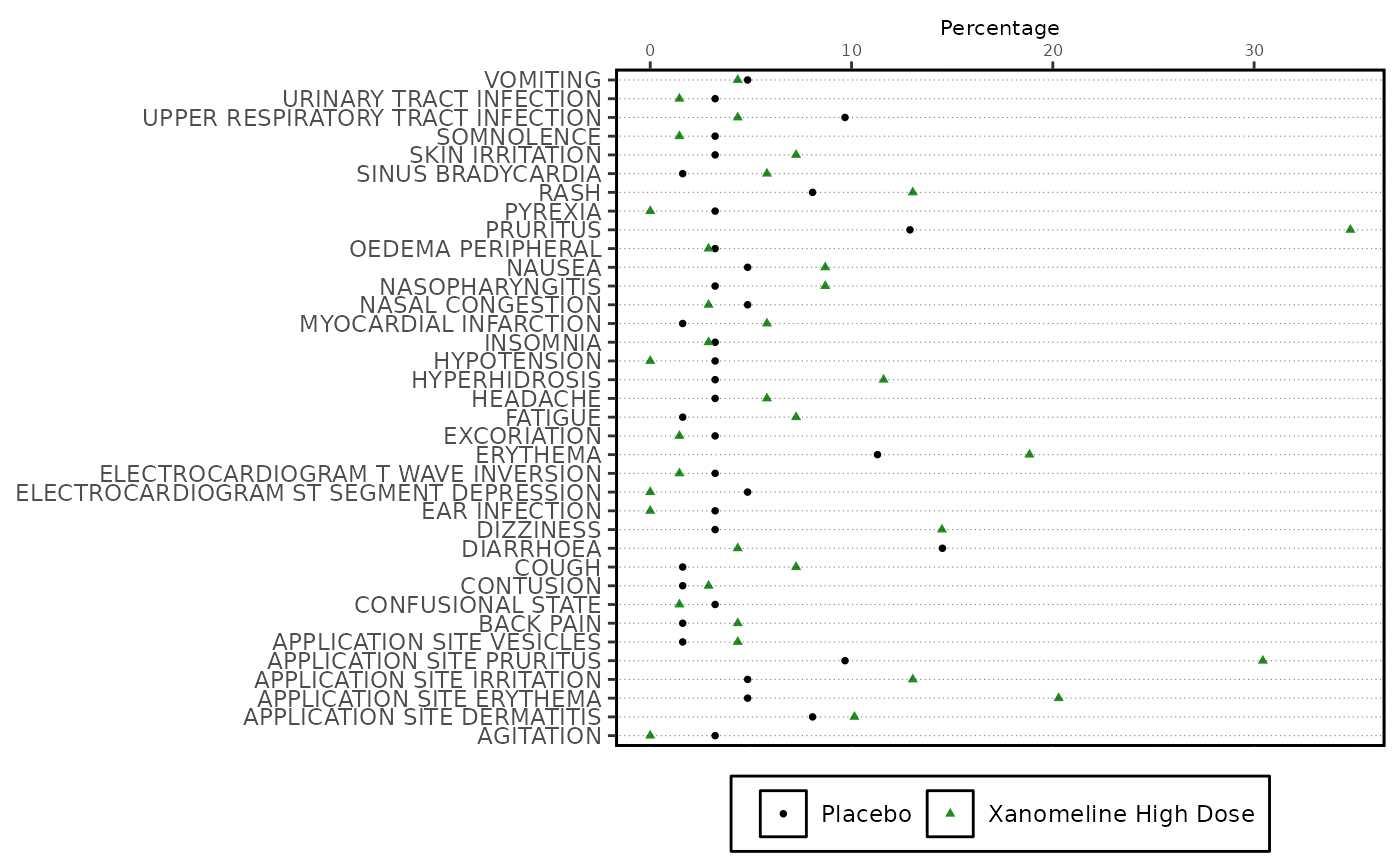
Scatter plot to be included within forest plot
Usage
forest_plot_scatter(
  datain,
  xvar = "PCT",
  yvar = "DPTVAL",
  series_var = "TRTVAR",
  series_labelvar = series_var,
  series_opts,
  hovervar = "HOVER_PCT",
  xaxis_pos = "top",
  legend_opts = list(pos = "bottom", dir = "horizontal"),
  hline_y = "Y",
  axis_opts = list(xsize = 8, xtsize = 6, xaxis_label = "Percentage")
)
Arguments
- datain
Input dataset, pre-processed.
- xvar
X-axis variable (continuous)
- yvar
Y-axis variable (discrete)
- series_var
Series Variable (To stratify by).
- series_labelvar
Series (Treatment) Variable labels for legend, if different from
series_var. If this is needed, thenseries_labelvarshould be a factor variable with levels corresponding toseries_var, also a factor.- series_opts
Series Variable styling options, a
listcontainingshape,colorandsize.- hovervar
Variable containing tooltip info (for interactive plot)
- xaxis_pos
Position of X axis and title. Values: "top"/"bottom"
- legend_opts
Legend styling option, a
listcontainingpos(position) anddir(direction).- hline_y
Horizontal line marking each Y variable to be plotted or not? "Y"/"N"
- axis_opts
A
listof axis specific options. Only following elements - xaxis_label, xsize, xtsize are utilised and required from list. eg. list(xaxis_label = "Percentage", xsize = 8, xtsize = 6)
Examples
data("adae")
ae_pre_process <- ae_pre_processor(
  datain = adae,
  obs_residual = 0
)

ae_entry <- mentry(
  datain = ae_pre_process$data,
  byvar = "AEBODSYS",
  trtvar = "TRTA",
  trtsort = "TRTAN",
  pop_fil = "SAFFL"
)

ae_risk <- risk_stat(
  datain = ae_entry,
  a_subset = ae_pre_process$a_subset,
  summary_by = "Patients",
  eventvar = "AEDECOD",
  ctrlgrp = "Placebo",
  trtgrp = "Xanomeline High Dose",
  statistics = "Risk Ratio",
  alpha = 0.05,
  cutoff_where = "PCT > 2",
  hoveryn = "Y"
) |>
  dplyr::mutate(key = dplyr::row_number())
#> mcatstat success
forest_plot_scatter(
  datain = ae_risk,
  xvar = "PCT",
  yvar = "DPTVAL",
  series_var = "TRTVAR",
  series_opts = list(
    color = g_seriescol(ae_risk, c("black", "forestgreen"), "TRTVAR"),
    shape = g_seriessym(ae_risk, NA, "TRTVAR"),
    size = rep(1, 2)
  ),
  hovervar = "HOVER_TEXT",
  xaxis_pos = "top"
)