Create box plot - static and interactive output
Arguments
- datain
Input dataset from
msumstat()output element$gsum- series_var
Series (Treatment) Variable.
- series_labelvar
Series (Treatment) Variable labels for legend, if different from
series_var. If this is needed, thenseries_labelvarshould be a factor variable with levels corresponding toseries_var, also a factor.- series_opts
Series Variable styling options, a
listcontainingshape,colorandsize.- axis_opts
A
listof axis specific options retrieved fromplot_axis_opts().- legend_opts
Legend styling option, a
listcontaininglabel,pos(position) anddir(direction).- ystat
Additional statistic to be plotted as markers. Default: mean
- boxfill
Whether box has fill color or not. Uses
series_opts$coloras box fill colors if "Y" or as box outline colors if "N". ("Y"/"N")- box_opts
Vector containing:
Width of individual boxes in plot and
Width of the interval between box-groups of X axis. eg. c(0.9, 0.9)
- griddisplay
Display Grid
(Y/N).- plot_title
Text to use as plot title, if required
Details
This function utilises data from processing steps to create boxplot.
Statistics required: In
msumstat()function prior, statvar should be c("median", "q25", "q75", "sd", "whiskerlow", "whiskerup", ystat) or "box" with ystat representing additional statistic to be calculated/plotted as points.series_labvarcan be, for eg "TRTTXT" if that variable contains modified labels for series_var (if "TRTVAR") to be shown in legend onlycolor,shape,sizeelements ofseries_optsshould be of the same length as or not less than number of levels/unique values in the variableseries_var- recommended to get fromplot_aes_opts()
Examples
data(adsl)
adsl_entry <- mentry(
datain = adsl,
subset = "EFFFL=='Y'",
byvar = "RACE",
trtvar = "TRT01A",
trtsort = "TRT01AN",
pop_fil = NA
)
adsl_sum <- msumstat(
datain = adsl_entry,
dptvar = "AGE",
statvar = c(
"mean", "median", "q25", "q75", "whiskerlow",
"whiskerup"
)
)[["gsum"]] |>
plot_display_bign(adsl_entry) |>
dplyr::mutate(XVAR = BYVAR1)
#> msum success
series_opts <- adsl_sum |>
plot_aes_opts(
series_color = c("red", "gold", "cyan"),
series_shape = c(16, 17, 15),
series_size = c(1, 1, 1)
)
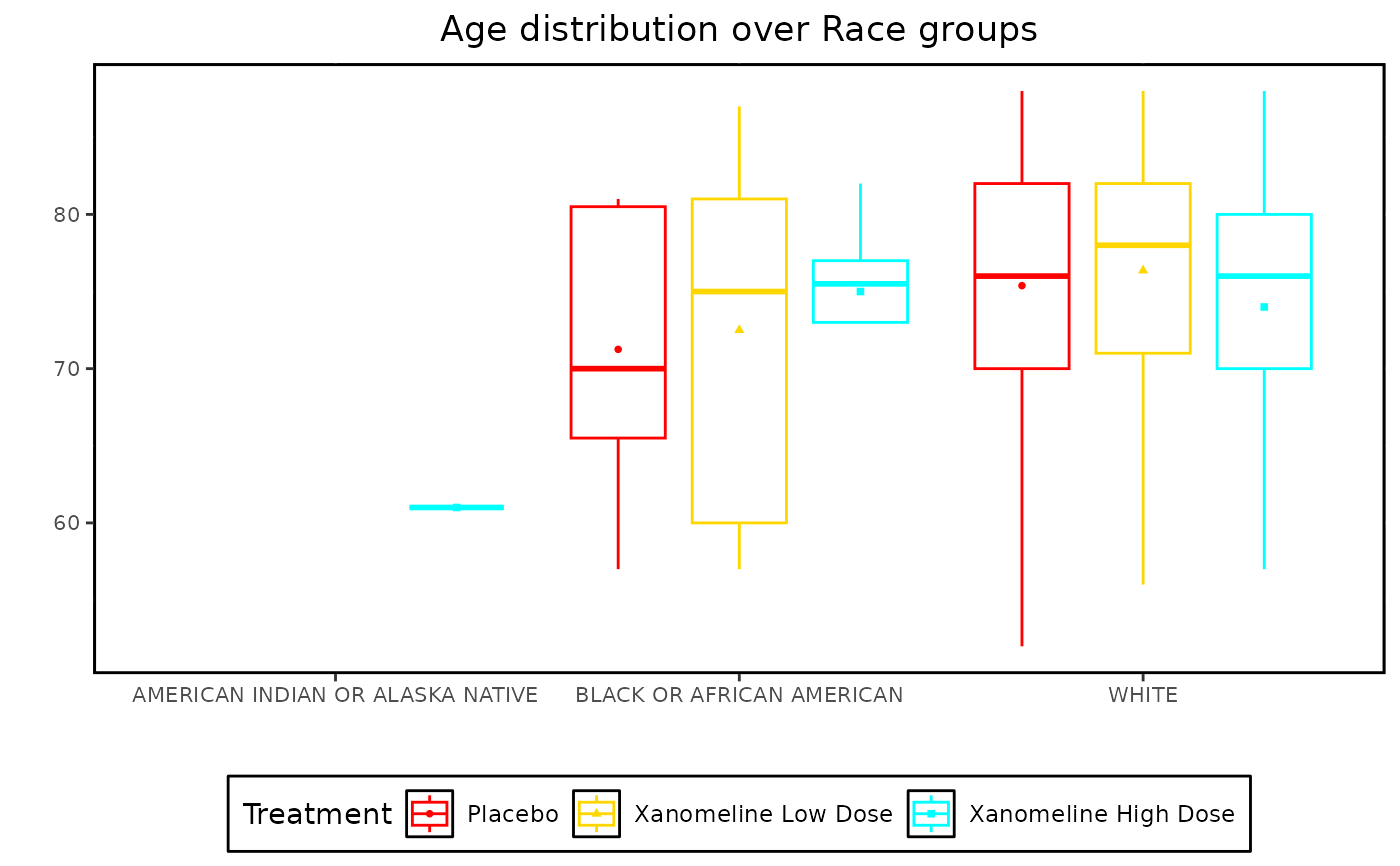
box_plot(
datain = adsl_sum,
axis_opts = plot_axis_opts(),
legend_opts = list(
label = "Treatment", pos = "bottom",
dir = "horizontal"
),
series_opts = series_opts,
plot_title = "Age distribution over Race groups"
)
#> Warning: There were 6 warnings in `mutate()`.
#> The first warning was:
#> ℹ In argument: `across(all_of(c(ystat, "median", "q25", "q75", whiskers)),
#> as.numeric)`.
#> Caused by warning:
#> ! NAs introduced by coercion
#> ℹ Run dplyr::last_dplyr_warnings() to see the 5 remaining warnings.
#> Box Plot Success
#> Warning: Removed 2 rows containing missing values or values outside the scale range
#> (`geom_segment()`).
#> Warning: Removed 1 row containing missing values or values outside the scale range
#> (`geom_segment()`).
#> Warning: Removed 2 rows containing missing values or values outside the scale range
#> (`geom_segment()`).
#> Warning: Removed 1 row containing missing values or values outside the scale range
#> (`geom_segment()`).
#> Warning: Removed 2 rows containing missing values or values outside the scale range
#> (`geom_point()`).