Utility for Bar plot.
Usage
bar_plot(
  datain,
  series_var = "TRTVAR",
  series_labelvar = series_var,
  series_opts,
  axis_opts = plot_axis_opts(),
  legend_opts = list(label = "", pos = "bottom", dir = "horizontal"),
  bar_pos = "dodged",
  bar_width = 0.7,
  flip_plot = "N",
  griddisplay = "N",
  plot_title = NULL
)
Arguments
- datain
output dataset from mcat/msumstat data; processed in graphics
- series_var
Series (Treatment) Variable.
- series_labelvar
Series (Treatment) Variable labels for legend, if different from
series_var. If this is needed, thenseries_labelvarshould be a factor variable with levels corresponding toseries_var, also a factor.- series_opts
Series Variable styling options, a
listcontainingcolorandcontrast.- axis_opts
A
listof axis specific options retrieved fromplot_axis_opts().- legend_opts
Legend styling option, a
listcontaininglabel,pos(position) anddir(direction).- bar_pos
Position of bars within group. Values: "dodged"/"stacked"
- bar_width
Width of individual bars numeric
- flip_plot
To flip plot axes or not. Values: "Y"/"N"
- griddisplay
Display Grid
(Y/N).- plot_title
Text to use as plot title, if required
Details
bar_pos determines position of bars when there is a grouping variable. If dodged is selected,
bars are placed adjacent to each other.
series_opts should be a list containing the element color (to fill bars), and optionally the
element contrast to outline the bars, per the series_var levels.
Examples
data(adsl)
adsl_entry <- mentry(
datain = adsl,
subset = "EFFFL=='Y'",
byvar = "RACE",
trtvar = "TRT01A",
trtsort = "TRT01AN",
pop_fil = NA
)
adsl_sum <- msumstat(
datain = adsl_entry,
dptvar = "AGE",
statvar = "mean",
figyn = "Y"
)[["gsum"]] |>
plot_display_bign(adsl_entry) |>
dplyr::mutate(
XVAR = BYVAR1,
YVAR = as.numeric(mean)
)
#> msum success
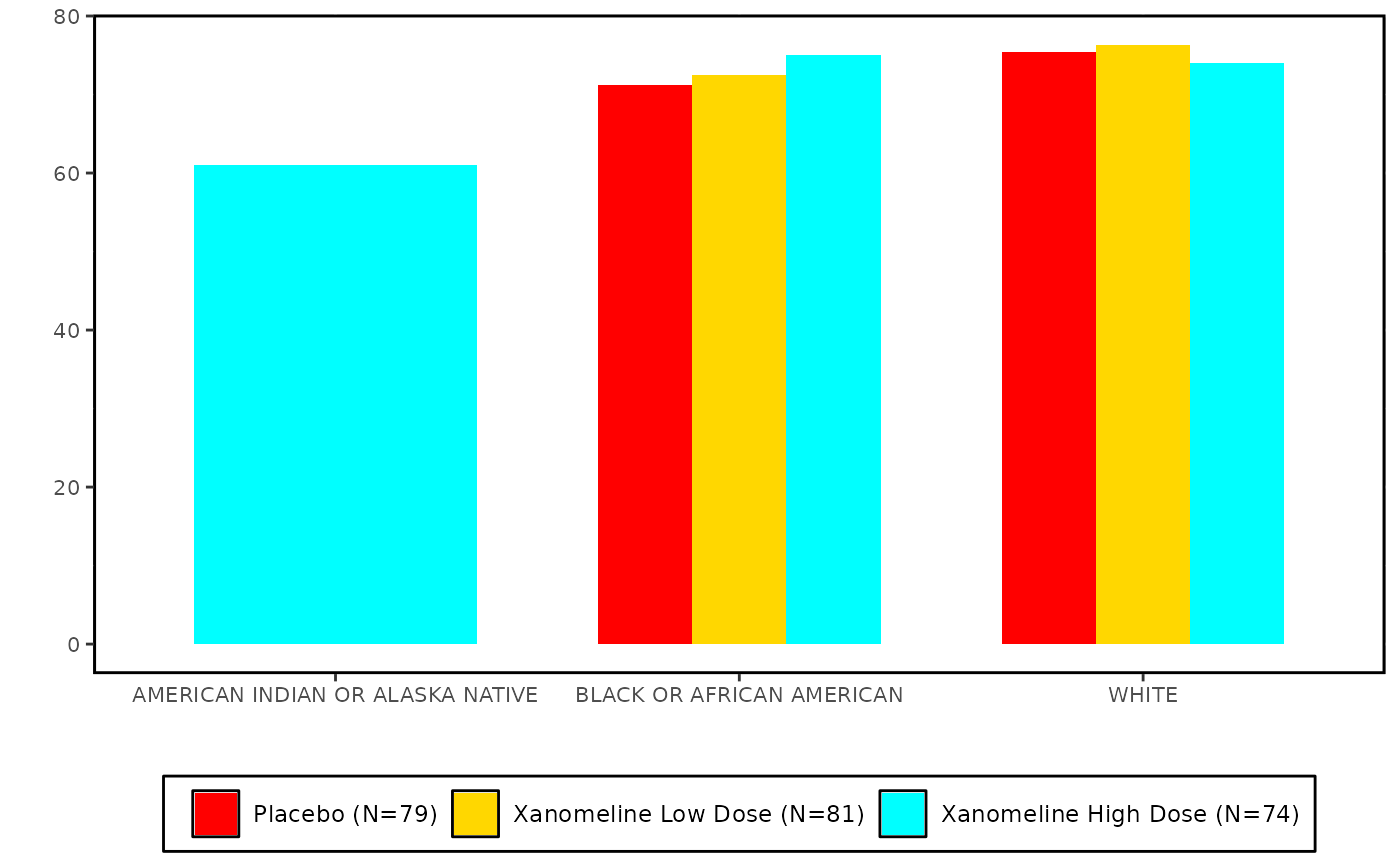
bar_plot(
datain = adsl_sum,
flip_plot = "N",
series_opts = list(
color = c("red", "gold", "cyan")
),
axis_opts = plot_axis_opts(),
legend_opts = list(
label = "", pos = "bottom",
dir = "horizontal"
),
series_var = "TRTVAR",
series_labelvar = "TRTTXT",
bar_pos = "dodged",
griddisplay = "N",
plot_title = NULL
)
#> Bar Plot Success