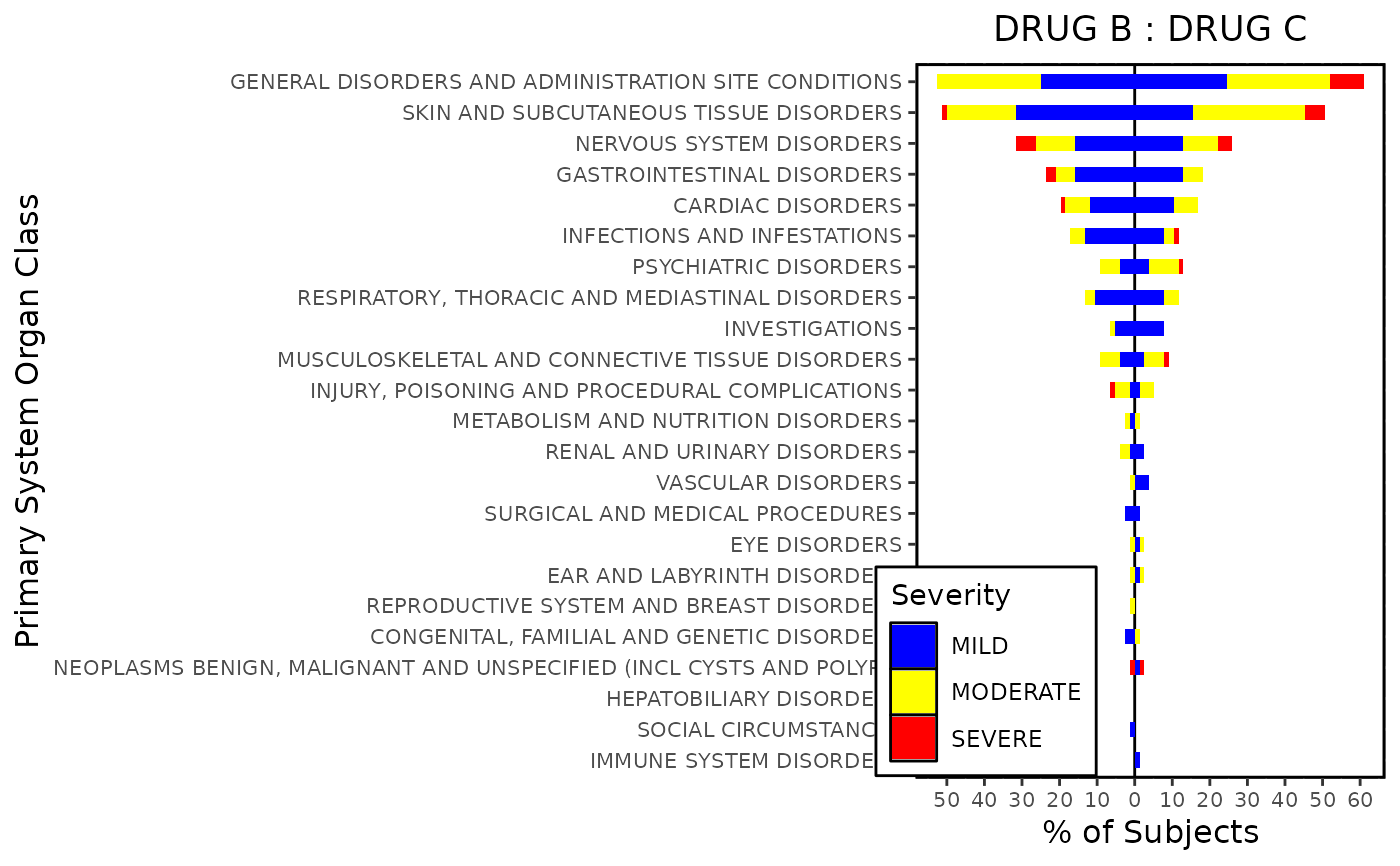
Tornado Plot
Usage
tornado_plot(
  datain,
  trt_left_label,
  trt_right_label,
  bar_width = 0.5,
  axis_opts = plot_axis_opts(xaxis_label = "Primary System Organ Class", yaxis_label =
    "% of Subjects", ylinearopts = list(breaks = seq(-100, 100, 10), labels =
    (c(seq(100, 0, -10), seq(10, 100, 10))))),
  legend_opts = list(label = "Severity", pos = c(0.15, 0.15), dir = "vertical"),
  series_opts,
  griddisplay = "N"
)
Arguments
- datain
An input dataframe retrieved from
process_tornado_data()`.- trt_left_label
A Treatment label for displaying left hand side plot.
- trt_right_label
A Treatment label for displaying right hand side plot.
- bar_width
Width of individual bars numeric
- axis_opts
A
listof axis specific options retrieved fromplot_axis_opts().- legend_opts
Legend styling option, a
listcontaininglabel,pos(position) anddir(direction).- series_opts
Series Variable styling options, a
listcontainingcolorandcontrast.- griddisplay
Display Grid
(Y/N).
Examples
data("adsl")
data("adae")

tornado_df <- process_tornado_data(
  dataset_adsl = adsl,
  dataset_analysis = adae,
  adsl_subset = "SAFFL == 'Y'",
  analysis_subset = "TRTEMFL == 'Y'",
  obs_residual = "30",
  fmq_data = NA,
  ae_catvar = "AESEV/AESEVN",
  trtvar = "ARM",
  trt_left = "Xanomeline High Dose",
  trt_right = "Xanomeline Low Dose",
  pctdisp = "TRT",
  denom_subset = NA_character_,
  legendbign = "N",
  yvar = "AESOC"
)
#> mcatstat success

series_opts <- g_seriescol(tornado_df, "blue~yellow~red", "BYVAR1")

tornado_plot(
  tornado_df,
  trt_left_label = "DRUG B",
  trt_right_label = "DRUG C",
  bar_width = 0.5,
  axis_opts = plot_axis_opts(
    xaxis_label = "Primary System Organ Class",
    yaxis_label = "% of Subjects",
    ylinearopts = list(
      breaks = seq(-100, 100, 10),
      labels = c(seq(100, 0, -10), seq(10, 100, 10))
    )
  ),
  legend_opts = list(
    label = "Severity",
    pos = c(0.15, 0.15),
    dir = "vertical"
  ),
  series_opts = series_opts,
  griddisplay = "N"
)
#> Warning: Removed 106 rows containing missing values or values outside the scale range
#> (`geom_col()`).
#> Warning: Removed 106 rows containing missing values or values outside the scale range
#> (`geom_col()`).
