Convert dataframe into ggplot object table
Arguments
- datain
Input dataframe
- xvar
X axis variable, acts as table columns
- yvar
Y axis variable, acts as values within columns
- labelvar
Label variable
- colorvar
Variable to color values by
- colors
Vector of colors to be used per
colorvar- text_size
Size of text printed in 'table'
- axis_opts
Axis options, list containing
xsize, andxaxis_labelfor X axis title; Includextsizeelement for ticks (column headers).
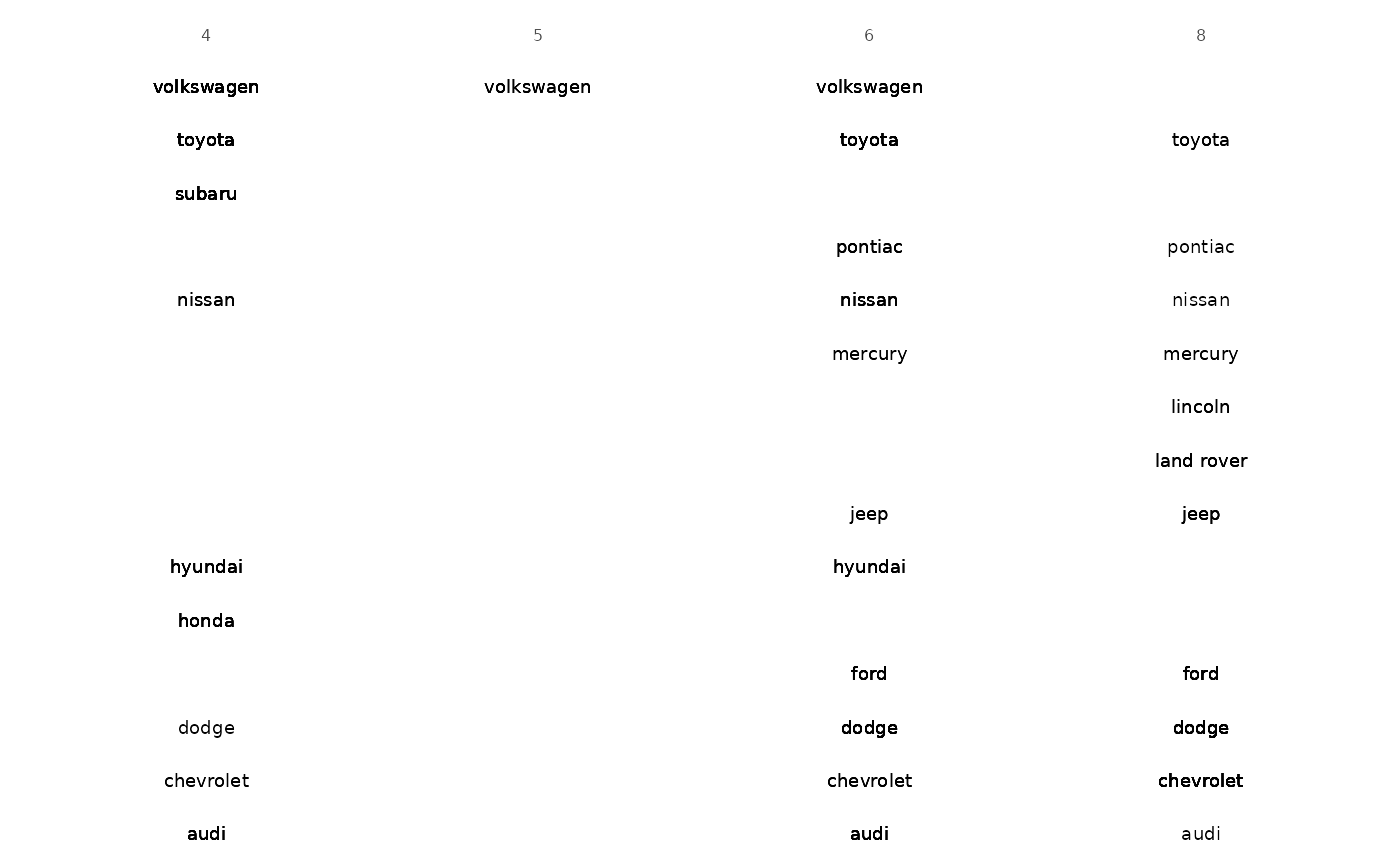
Examples
MPG <- ggplot2::mpg
MPG[["cyl"]] <- as.character(MPG[["cyl"]])
tbl_to_plot(
  MPG,
  "cyl",
  "manufacturer",
  "manufacturer"
)