Create Scatter Plot
Usage
scatter_plot(
  datain,
  axis_opts = plot_axis_opts(),
  series_var,
  series_labelvar,
  series_opts,
  legend_opts,
  plot_title = "",
  griddisplay = "N"
)
Arguments
- datain
Input
data.frame.- axis_opts
A
listof axis specific options retrieved fromplot_axis_opts().- series_var
Series (Treatment) Variable.
- series_labelvar
Series (Treatment) Variable labels for legend, if different from
series_var. If this is needed, thenseries_labelvarshould be a factor variable with levels corresponding toseries_var, also a factor.- series_opts
Series Variable styling options, a
listcontainingshape,colorandsize.- legend_opts
Legend styling option, a
listcontaininglabel,pos(position) anddir(direction).- plot_title
Text to use as plot title, if required
- griddisplay
Display Grid
(Y/N).
Examples
library(dplyr)
#>
#> Attaching package: ‘dplyr’
#> The following objects are masked from ‘package:stats’:
#>
#> filter, lag
#> The following objects are masked from ‘package:base’:
#>
#> intersect, setdiff, setequal, union
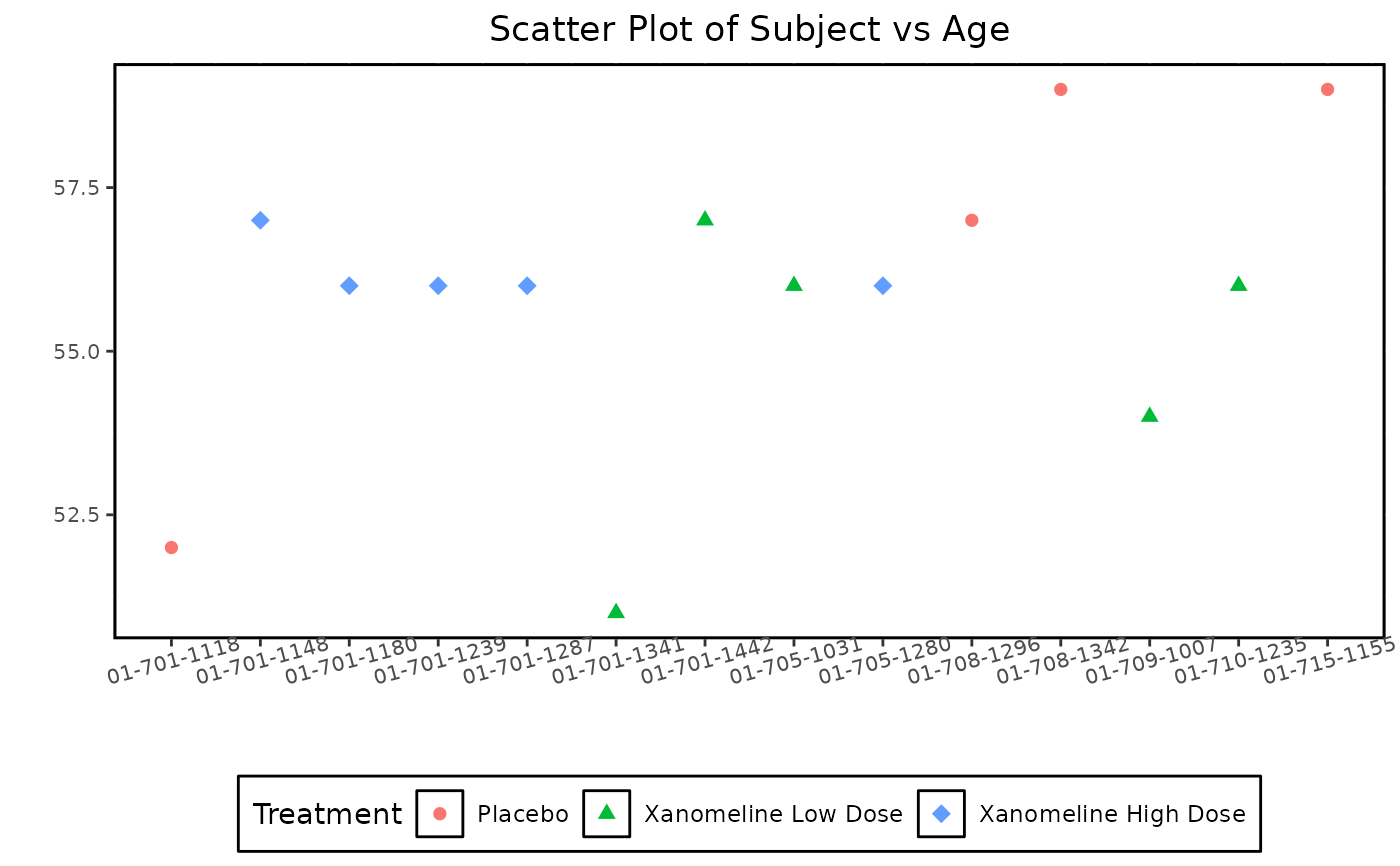
# Example 1
data(adsl)
mentry_df <- adsl |>
mentry(
subset = "AGE < 60",
byvar = NA_character_,
trtvar = "TRT01A",
trtsort = "TRT01AN",
subgrpvar = NA_character_,
trttotalyn = "N",
add_grpmiss = "N",
pop_fil = "SAFFL"
) |>
dplyr::mutate(XVAR = as.integer(factor(USUBJID)), YVAR = AGE)
mentry_df |>
scatter_plot(
axis_opts = plot_axis_opts(
xlinearopts = list(
breaks = sort(unique(mentry_df$XVAR)),
labels = sort(unique(mentry_df$USUBJID))
),
xopts = list(angle = 15)
),
series_var = "TRTVAR",
series_labelvar = "TRTVAR",
series_opts = list(
shape = c(16, 17, 18),
color = scales::hue_pal()(3),
size = c(2, 2, 3)
),
legend_opts = list(
label = "Treatment",
pos = "bottom",
dir = "horizontal"
),
plot_title = "Scatter Plot of Subject vs Age"
)
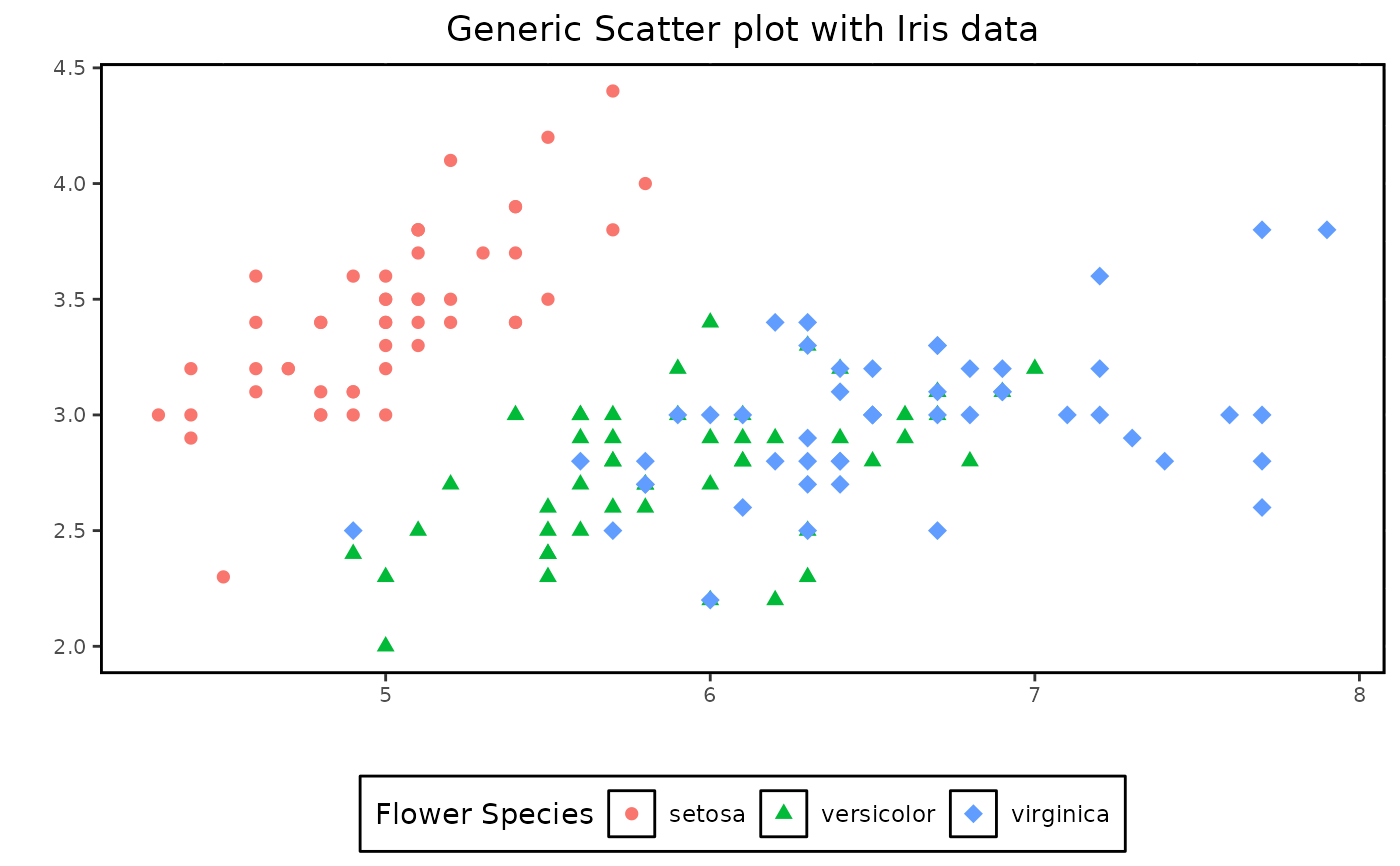
 # Example 2
iris |>
### this step is required for `scatter_plot()` to work as it requires `XVAR` and `YVAR` present
### in the data
mutate(XVAR = Sepal.Length, YVAR = Sepal.Width) |>
scatter_plot(
axis_opts = plot_axis_opts(),
series_var = "Species",
series_labelvar = "Species",
series_opts = list(
shape = c(16, 17, 18),
color = scales::hue_pal()(3),
size = c(2, 2, 3)
),
legend_opts = list(
label = "Flower Species",
pos = "bottom",
dir = "horizontal"
),
plot_title = "Generic Scatter plot with Iris data"
)
# Example 2
iris |>
### this step is required for `scatter_plot()` to work as it requires `XVAR` and `YVAR` present
### in the data
mutate(XVAR = Sepal.Length, YVAR = Sepal.Width) |>
scatter_plot(
axis_opts = plot_axis_opts(),
series_var = "Species",
series_labelvar = "Species",
series_opts = list(
shape = c(16, 17, 18),
color = scales::hue_pal()(3),
size = c(2, 2, 3)
),
legend_opts = list(
label = "Flower Species",
pos = "bottom",
dir = "horizontal"
),
plot_title = "Generic Scatter plot with Iris data"
)