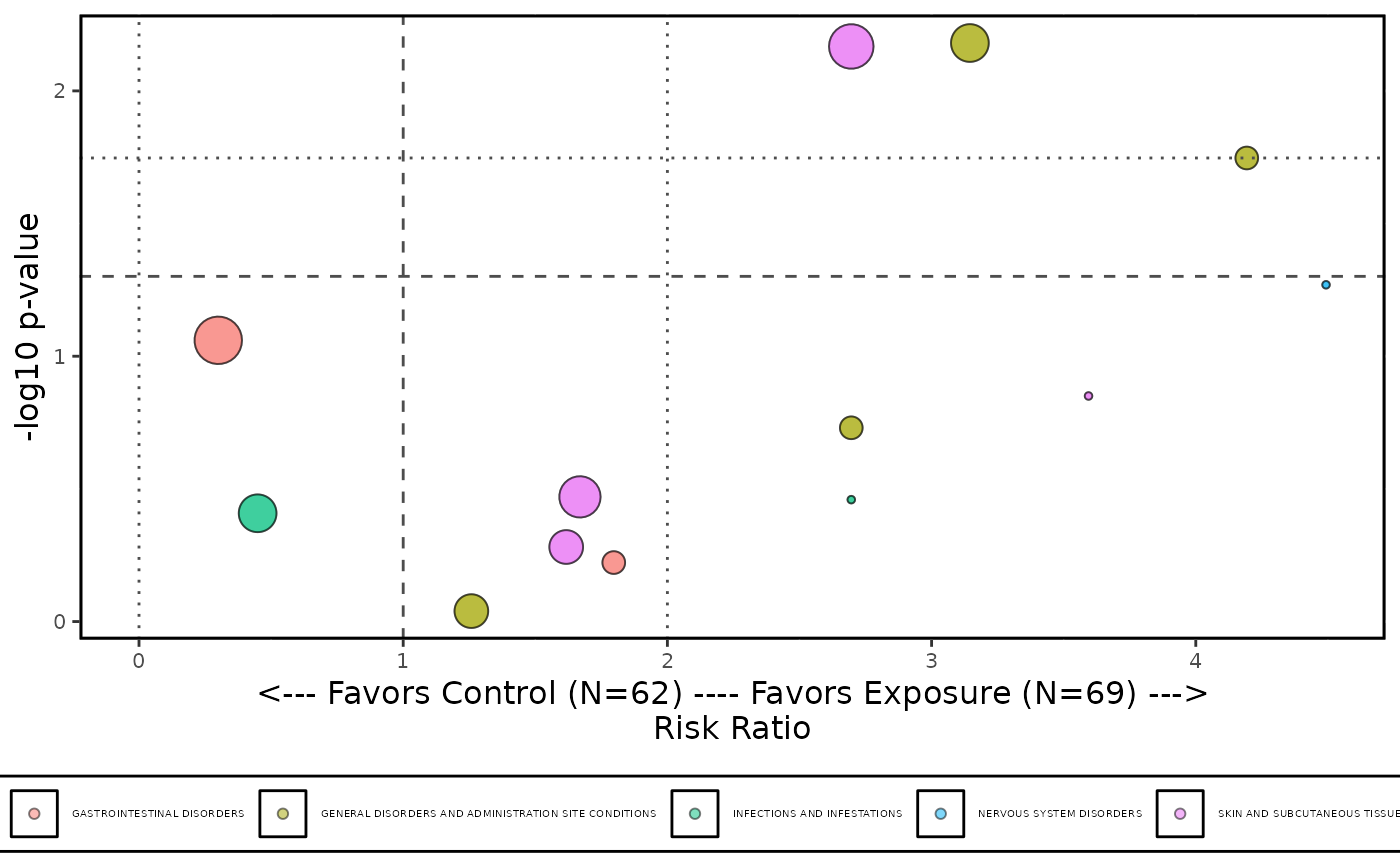
Generate Volcano Plot of Adverse Events from Risk values of treatment pairs
Source:R/ae_volcano_plot.R
ae_volcano_plot.RdGenerate Volcano Plot of Adverse Events from Risk values of treatment pairs
Arguments
- datain
(
data.frame)
Input dataset containing statistics for treatment pairs from AE data, generated byrisk_stat().- axis_opts
A
listof axis specific options retrieved fromplot_axis_opts()andae_volcano_opts().- legend_opts
Legend styling option, a
listcontaininglabel,pos(position) anddir(direction).- xref
(
numeric)
Numeric vector, fromae_volcano_optsFirst value will be the main reference, all drawn vertically.- pvalue_sig
(
numeric)
p-value cut-off, filter values with adjustedpless than this argument- interactive
Return interactive plot or static. Values: "Y"/"N".
Details
It is recommended not to change pos and dir in legend_opts; additionally, these options
are fixed for the case of interactive = Y and cannot be changed.
xref must be of length 2 or more.
Input datain from risk_stat() should only contain one treatment pair and not more.
Examples
data("adae")

ae_pre <- ae_pre_processor(
  datain = adae,
  obs_residual = 0,
  fmq_data = NA
)

ae_entry <- mentry(
  datain = ae_pre$data,
  subset = NA,
  byvar = "AEBODSYS",
  trtvar = "TRTA",
  trtsort = "TRTAN",
  subgrpvar = NA,
  trttotalyn = "N",
  add_grpmiss = "N",
  sgtotalyn = "N",
  pop_fil = "SAFFL"
)

ae_risk <- risk_stat(
  datain = ae_entry,
  a_subset = ae_pre$a_subset,
  summary_by = "Patients",
  eventvar = "AEDECOD",
  ctrlgrp = "Placebo",
  trtgrp = "Xanomeline High Dose",
  statistics = "Risk Ratio",
  alpha = 0.05,
  cutoff_where = "FREQ >5",
  sort_opt = "Ascending",
  sort_var = "Count"
)
#> mcatstat success

vaxis_opts <- ae_volcano_opts(
  ae_risk,
  "Control",
  "Exposure",
  pvalue_trans = "-log10"
)

axis_opts <- plot_axis_opts(
  ylinearopts = vaxis_opts$ylinearopts,
  yaxis_scale = vaxis_opts$yaxis_scale,
  xaxis_label = vaxis_opts$xaxis_label,
  yaxis_label = vaxis_opts$yaxis_label
)

ae_risk |>
  ae_volcano_plot(
    axis_opts = axis_opts,
    xref = vaxis_opts$xref
  )